On reflection this question is way too hard for an exam and I have changed it to give a lot of information like service of active and deferred members etc. However reading this through will still be a useful 'think like an actuary' exercise
Exam type question. (Overly Hard)
You are the scheme actuary for a company final salary scheme, which closed to new members, 10 years ago, but is still open for future accrual.
The company which sponsors it is a car manufacturer which is based in the North East of England. Many of the employees are skilled manual workers who have worked there all their lives, with many families having had multiple generations having worked at the same factory.
The defined benefit scheme is very standard with 60ths accrual, NRA of 65, spouse's pension of 50% and increases in deferment and payment which are linked to inflation but capped at 5%.
There are 400 members in the final salary scheme (120 of these are active, 150 are deferred and 130 are retired). The new joiners go straight into a defined contribution scheme which has an employer contribution of 5% and an employee contribution of 5%.
The average past service for each group: active deferred and pensioners is 12 years
The average wages at present are £500 per week
a) Stating all your assumptions
iA) Reasonableness check the scheme demographics
Suggested solution
Scheme demographics
Look at the graph below:
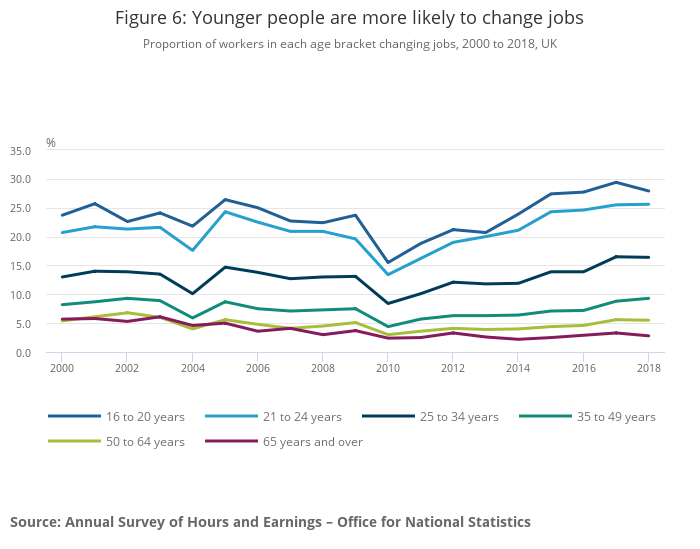
Younger workers tend to have much higher turnover, but this is not largely relevant for this pension scheme, as the scheme is closed to new members and we can see the length of employment tends to be longer.
For this membership we are probably looking at around 8% turnover. so 12 years past service seems reasonable.
It is tempting to think that deferred members will have more service as they have now left but deferred members are skewed towards those that have left, whereas active members are skewed towards those that have stayed.
Also active members must have been there since the DB scheme closed (we are not told when this was) but would most probably be at least five years ago. It seems reasonable therefore to suggest that all three groups active, deferred and pensioners may have accrued 12 years service on average.
For a factory with skilled workers salaries will be close to the UK average of £29,600 per year. £500 per week therefore seems quite reasonable. See spreadsheet for more detailed breakdown
iB) Estimate the liabilities of the final salary scheme.
Suggested solution
Demographics Assumptions
We would also estimate the future working lifetime (for salary increase purposes) of the active members as 12 years, given turnover appears to be about 8%
We will assume a mainly male workforce (for very approximate calculations this is probably appropriate given the type of work).
The North East of England will experience higher mortality that the rest of the UK see spreadsheet. The ratio of the north east mortality 1220 to the UK mortality 1096 = 1.1 gives us an idea of the extent of this.
10% higher mortality reduces life expectancy for someone with a life expectancy of 20 years by about 2 years.
We can adjust our rule of 20 life exp at 64 to 18 years at 64 and given retirement age is 65 then we get a life expectancy at retirement of 17. We could make a further adjustment for manual work so lets say we reduce it to 16 in this case. (very crude - but shows the examiner you are aware of the issue).
The average age of our active members weighted by accrual will be higher than the middle of 18 to 65 (41.5) given scheme is closed (add say 5 years) and the triangular effect of increasing accrual (add say another 5 years). Let us assume that the average accrual weighted age of the active members is 50.
We should expect the average accrual weighted age of the deferreds to be a bit higher given they have left but the closer workers get to retirement the less they tend to change jobs so this will not be much higher say 52. The average age of the pensioners will be about 16/2 + 65 = 73.
Financial Assumptions
Fundamentally pensions are bond like so we tend to follow the yield curve of government bonds to guide our discount rate assumptions
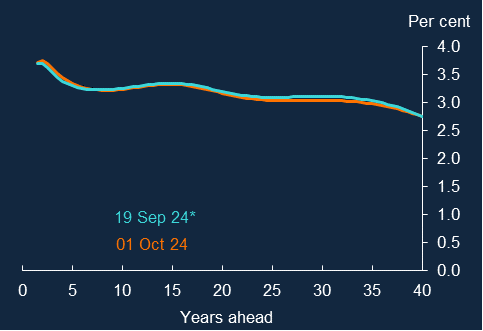
Consider the following graph from the BoE website(of nominal yield curve from 2024):
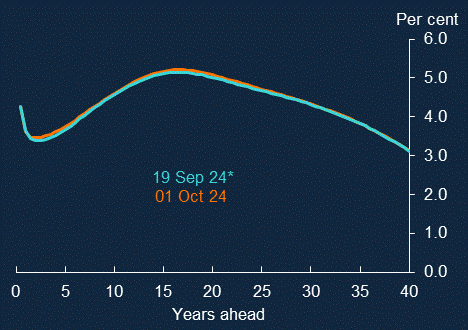
Given the average age at death will be about 73, the duration of the active liabilities will be about 73-50 = 23 years.
The duration of the deferred liabilities will be about 73-52 = 21 years
The life expectancy of the pensioner members will be about 1/2 * 16 = 8, which is the reverse effect from building up accrual as an active member. However the duration will be about 5 years (i.e. approx 1/3 of 16, which is the reverse effect from building up accrual as an active member)
So we can use gilt rates of 5% for active members, 5% for deferred members and 4% for pension members. (crudely reading off graph in this case.
We could reduce these rates (especially active and deferred) as you will notice they happen to coincide with the higher interest rates on the curve, and in practice the liabilities will be spread either side of these durations.
The real yield curve shows modest but positive real yields at the moment
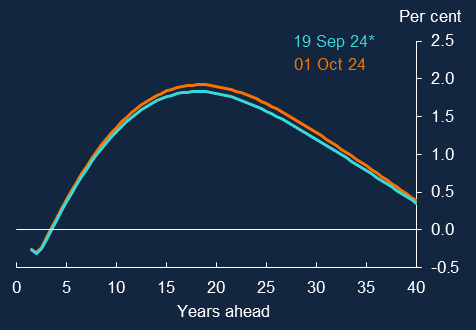
and consequently the implied inflation rate is high:
Although historically inflation has been lower, averaging roughly 2% over the first part of the 21st century up until the pandemic- so ONS data
Although historically we think of pay as exceeding inflation by about 2% per year the last few years data suggest this has not been true for some time.
It is a matter of debate amongst economists whether the long term wage growth will exceed price rises in the future.
Overall it is reasonable to assume that pay and prices have been quite closely aligned over the last 10 years if not longer and that deferred pensions and pensions in payment will reflect this.
So we will assume pay increases of 3% nominal and inflation of 2% nominal, but a higher inflation increase assumption would not be unreasonable given the BoE data.
Valuation Calculations
So looking at each cohort:
Actives
Fundamentally we are doing this: $PV \approx members\times \frac{FS \times N}{acc} \times \frac{(1+sal\_inc)^{fwl} (1+inf)^{NRA-age-fwl}}{(1+i)^{NRA-age}} \times a_{NRA}^{@i-inf\%} \times _{NRA-age}p_{age}$
So our calculation is: $120 \times \frac{26000 \times 12}{60} \frac{1.03^{12} \times 1.02^3}{1.05^{15}}\times 16 \times \frac{1.02^8}{1.05^8} \times 0.9$
So sort this out: $\approx 9m \times (1.01)^{36+6-75+16-40} \approx 9m \times 0.5 \times 1.01^13 \approx 4.5m \times (1.13) \approx 5.1m$
Note: 12/60 = 1/5, 1/5 * 120 = 24, 24 * 26 = 624 (difference of two squares), 625 (almost 624) * 16 = 10000 (as 1/16=0.0625) then times 0.9 so whole thing before discounting is 9m approx
Deferreds
Now we are doing this: $PV \approx members\times \frac{FS \times N}{acc} \times \frac{(1+inf)^{NRA-age}}{(1+i)^{NRA-age}} \times a_{NRA}^{@i-inf\%} \times _{NRA-age}p_{age}$
So our calculation is: $150 \times \frac{26000 \times 12}{60} \frac{1.02^{13}}{1.05^{13}}\times 16 \times \frac{1.02^8}{1.05^8} \times 0.9$
$\approx 27 \times 16 \times 26000 \times 0.99^{63} \approx 6.0m$
We should note here that the use of £500 for the final salary is potentially problematic as they will have left some time ago when the salaries were lower, but those deferred benefits will have been increased with inflation so if salary rises and inflation have been in line over recent years then this assumption will be fine
Pensioners:
We are now looking at typically liability-weighted average age of pensioners being a third of he way through retirement and the duration of the average pension being about one third of the total average pensions span.
Again we will work with the £500 figure as their historic final salaries would have been revalued up to this point
So now we are doing this: $PV \approx members\times \frac{FS \times N}{acc} \times a_{WAA}^{@i-inf\%} $
So this is $\approx 130 \times \frac{26000 \times 12}{60} \times 10.7 \times \frac{1.02^{5.3}}{1.05^{5.3}} \approx 6.2m$
Remainder of question using old financial data - update to follow shortly
ii) Estimate how much the liabilities would change if the long term interest rate were to increase by 1%
Suggested Solution
To answer this we need to consider the overall duration of the liabilities. This means calculating the weighted average duration of the liabilities.
We have:
| Group | members | Total Liabilities (m) | Duration |
|---|
| Active | 120 | 5.1 | 23 |
| deferred | 150 | 5.7 | 21 |
| Pensioner | 130 | 6.2 | 6 |
So the weighted average duration is (6.2*5.3+5.7*21+5.1*23) / (6.2+5.7+5.1) = 16 approx.
Therefore a 1% change in interest rates will change the liabilities by about 16%.
So a 1% increase in interest rates would make the liabilities about 0.85 * 17m = £14.5
0.85 rather than 0.84 as at 16% second order quadratic effects are starting to kick in a little
Question updated down to here with update 2024 figures.
iii) Estimate how much pension you believe a typical DC member will receive if they work at the factory from age 25 to age 65.
Suggested Solution
Over this long a period it probably makes sense to assume that wages will exceed prices and use long term assumptions rather than market conditions. So we could say we expect prices to rise at 2% and wages at 3%. Often long term assumptions are that wages rise at 2% faster than prices but choosing 1% is sensible, although it is not conservative as it may under-estimate the liabilities if salary growth turns out to be higher.
It would also make sense to do the calculation in real terms so that we produce numbers that look realistic. We are not told what the investments are or what their returns are so we will initially assume a bond like investment that returns 1% nominal and so -1% real.
The real salary growth means that half way through the 40 year period that salary will be about 20% higher i.e. £600 per week or £31,000 per year. 10% of this effectively means putting £3,100 into your pension each year, but the average payment will be in the pension for 20 years and will lose about 20% of its value due to negative real interest rates.
So the total pension pot is looking like being 40 * 3,100 * (0.8) =(approx) £100,000.
You may hope for an annuity of 17 at retirement given our earlier calculations, but this ignores improving mortality, risk margins, profits, equalisation between men and women. In reality typical annuity rates (for index linked annuities) would be about 94 - age = 29.
So you could expect a pension of about £3,500 per year.
The investment assumption was critical here. If instead of assuming gilts yields we assumed that equities were used and that they returned a dividend yield of 3% on top of real economic growth then the calculation "40*3,100*0.8" becomes 40 * 3,100 * 1.03 ^ 20 = approx 40 * 3,100 * 2 (rough rule of 70) =(approx) 240,000, giving a pension of over £8,000.
You could also leave your pension invested in the stock market and receive say 3% dividends of about £7,200 per year while retaining the capital invested.
The investment strategy is currently 70% equities, and 20% fixed interest corporate bonds and 10% long dated government gilts.
The funding level is currently 85% on a gilt basis
iv) Estimate how much the company should fund the scheme by each year in order to restore the scheme to 100% funding over a 10 year period.
Suggested Solution
The are two reasons for putting more money into a pension scheme: One is to deal with underfunding. The other is to fund ongoing accrual. Ongoing accrual only applies to active members.
If (a big if) we assume the basis is government gilts then the liabilities are 39,000,000 and so 85% funded means the assets are approx 33,000,000. so we need to put an extra £600,000 in each year to deal with historic underfunding.
the ongoing accrual is for 1 years accrual where the value of 12 years accrual is £119,000 so one years accrual will be about £10,000 and across 120 members this becomes £1,200,000 per year. So the ongoing funding requirement is £1,800,000.
v) Outline the financial impacts of the investment strategy giving illustrative financial projections of different investment circumstances.
Suggested solution
We have already seen that a 1% swing in interest rates will mean a £7,000,000 swing in liabilities. However 30% of the assets of £33,000,000 are bonds so these will move in the same direction. You would hope that the government gilts would be of the appropriate duration but the corporate bonds will probably not be.
Corporate bonds are more likely to be of around 7 years duration at most, and therefore have roughly 1/3 of the interest rate sensitivity.
So if we have £6,600,000 of gilts with duration 20 years and £3,300,000 of corporate bonds with duration 7 years then a 1% increase in interest rates will decrease the value of the portfolio by 20% of £6,600,000 + 7% of £3,300,000 =(approx) £1,500,000.
So we can see that overall a 1% change in interest rates will change the funding level by about £5,500,000.
What about the equities. We have about £23,000,000 in equities and equity markets experience annual volatility of about 20% per year. so a 1 in 20 event would be about 1.96 times this i.e 40%. This equates to a fall in your portfolio of £9,200,000. So you can see this is a very material risk.
 How much does a decent pension of say two thirds of final salary really cost?